NZ is known as a low wage & low productivity economy. It is our view we don’t have to be either.
Key considerations
First, consider productivity. The examples below are real examples. Before I started working with these clients, neither business owner was aware of or knew how to address the problems. With a focussed effort, significant productivity improvements can be achieved. The outcome will be a vastly better financial result.
Secondly consider low wages. Employers will be under pressure to review and increase wages. If you increase wages without a corresponding increase in either price or productivity, your business will be going backwards financially! Price sensitivity could result in reduced profit so price increases are risky. Improving productivity, however, carries little risk and will not affect your customers.
Addressing the productivity issues will position you to confidently start remunerating your team and obtain a win/win outcome.
Poor productivity examples
I’d like to share with you two examples of poor productivity I mentioned earlier.
1. A motor vehicle service business using SAM software:
The Labour Analysis summary report for September showed that for every 100 hours of wages paid out, only 57 hours were billed. Productivity was therefore measured at 57%, based on hours paid versus hours charged.
Increasing billable hours from 57 per 100 to 75 per 100 equates to a 32% productivity improvement. This would result in labour billings increasing by $7,000 per month plus parts supplied, a significant improvement to the bottom line!
2. A large mechanical services business
On average this company had about 60 site staff working on a variety of projects around Auckland. The owner felt they should be 30% more productive with a concerted approach to continuous improvement.
Imagine what a 10% improvement would do to the business bottom line. A 10% saving would be the equivalent of 6 full-time staff for a year. The average wages cost per employee was $47,000 equating to a wage saving of $282,000 which would increase billable labour hours by $564,000 for the full year.
Continuous Improvement
Labour intense industries present a huge opportunity to introduce a Continuous Improvement philosophy to make significant productivity gains.
- The financial performance of your business is determined by a multitude of factors with bottom-line profitability the outcome of all of these.
- Focusing your energies on improving the inputs can have huge benefits.
- Typically, these inputs will be around operational performance.
The key takeaway here is:
The financial performance of your business is the outcome of a multitude of inputs, none of which are of a financial nature!
How do we define productivity in a labour-intense business?
It can be as simple as the hours we get paid versus the hours we actually work. [Productivity Ratio].
It is a well-known fact that “time is money”. A great place to start your productivity improvement project is identifying the causes of lost time.
The key to understanding the severity of lost time situations is measuring them. To do this successfully will require discipline from both supervisors and staff and will require good communication if it is to be well received. It is worth the effort, however. You will no doubt be familiar with the saying – “You can’t manage what you don’t measure.”
Pareto charts
A Pareto chart is a basic tool for process improvement. You can think of the benefits of using Pareto charts in economic terms.
“A Pareto Chart breaks a big problem into smaller pieces (and) identifies the biggest contributors. . . (It can) help us get the most improvement with the resources available by showing where to focus efforts to maximize achievements. The Pareto Principle states that a small number of causes account for most of the problems. Focusing efforts on the ‘vital few’ causes is usually a better use of valuable resources”.
The Pareto Principle is in fact the 80 / 20 Rule – 80% of the trouble comes from 20% of the problems.
Hypothetical example
Below is a summary of a range of causes of lost time and the number of incidences of each in an organisation over a 1 month period.
| Problem category | Frequency per Month | Percentage | Cumulative % |
| Long smokos & lunches | 75 | 28% | 28% |
| Arrive late, leave early | 60 | 23% | 51% |
| Waiting | 40 | 15% | 66% |
| Double handling | 35 | 13% | 79% |
| Materials short-supplied | 10 | 4% | 83% |
| Labour shortage | 10 | 4% | 87% |
| Made wrong | 8 | 3% | 90% |
| Absenteeism | 7 | 3% | 92% |
| Wrong materials | 6 | 2% | 95% |
| Materials oversupplied | 5 | 2% | 97% |
| Lack of supervision | 5 | 2% | 98% |
| Restricted access | 4 | 2% | 100% |
| Weather | 3 | 1% | 100% |
| Materials stolen | 2 | 1% | 100% |
| Design change | 1 | 0% | 100% |
| Total occurrences | 265 |
The Data from this table is represented in the Pareto chart below, which is a clear illustration of the 80/20 rule.
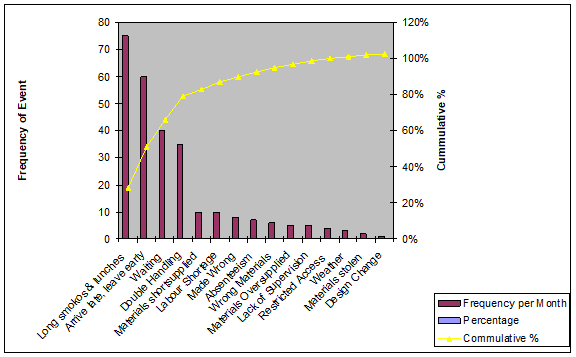 This graph shows that 80% of all recorded lost time instances are from the 4 most common problems. This suggests that by focusing on these common problems, identifying the root cause and eliminating or minimizing these problems, will get the best outcome for your business.
This graph is derived from hypothetical data. To obtain actual data would require monitoring and recording the causes of all instances of lost time from all jobs and collating into a table.
Low productivity is a huge issue for many New Zealand businesses. If you continue doing what you have always done, you will continue getting the same result!
Getting started
A great time to start your Continuous Improvement project is when you get back to the office in the New Year, fresh from a good break and raring to go. First, consider why you have not addressed this problem before? Perhaps you are always too busy? Maybe you were not sure where to start.
Next, bring in some external expertise. Now is a great time to engage with a business adviser specialising in productivity improvement strategies. Reach out for a complimentary introduction on how we may be able to help you bank some of the gains available.
By Trevor Clark | Partner | Business Advisor
More reading
Read Trevor’s article on why there is an urgent need to Improve productivity